
Risk Reward Calculator for Forex and Gold
This risk reward calculator turns your entry, stop loss and take profit into the R:R ratio, the dollars at stake on each side, the win rate you need to break even, and what spread and commission do to the plan.
- R:R ratio
- Profit and loss in dollars
- Break-even win rate
- Spread and commission
Trade ticket
Costs and account (optional)
Result
| Target | Price | Profit | Note |
|---|
The win rate each ratio needs
A risk to reward ratio means nothing until you pair it with how often the trade works. This table shows the break-even win rate for common ratios, before spread and commission. The bar is the share of trades that has to win just to stand still.
| Risk : reward | Break-even win rate | Share of trades |
|---|---|---|
| 1:0.5 | 66.7% | |
| 1:1 | 50.0% | |
| 1:1.5 | 40.0% | |
| 1:2 | 33.3% | |
| 1:2.5 | 28.6% | |
| 1:3 | 25.0% | |
| 1:4 | 20.0% | |
| 1:5 | 16.7% |
Once you know the break-even number, compare it with the win rate in your own records. The expectancy calculator turns a win rate and an average win and loss into the edge per trade, and the risk of ruin calculator shows how a losing streak can hurt an account.
What spread and commission do to a 1:2 plan
Costs are paid on every trade, win or lose, so they bite hardest on small stops. This grid takes a plan with a target exactly twice the stop and shows the R:R you actually get once the round turn cost is added to the risk and taken off the reward.
| Stop size | 0.5 pip cost | 1 pip cost | 2 pip cost | 3 pip cost |
|---|---|---|---|---|
| 5 pips | 1.73 | 1.50 | 1.14 | 0.88 |
| 10 pips | 1.86 | 1.73 | 1.50 | 1.31 |
| 15 pips | 1.90 | 1.81 | 1.65 | 1.50 |
| 20 pips | 1.93 | 1.86 | 1.73 | 1.61 |
| 30 pips | 1.95 | 1.90 | 1.81 | 1.73 |
| 50 pips | 1.97 | 1.94 | 1.88 | 1.83 |
To price the cost side properly, use the pip value calculator to see what a pip is worth on your pair, the swap calculator if you hold overnight, and the trading cost calculator to compare spread and commission between accounts.
Where the target goes
Place the stop first, where the idea is simply wrong, not where a nice ratio would fit. Only then look at what the market offers on the other side.
If the nearest sensible target pays less than your break-even math needs, do not move the stop closer to rescue the ratio. Skip the trade. A ratio you manufacture by squeezing the stop is the one that gets stopped out.
Once a trade is open, the plan can change shape. The partial take profit calculator shows how scaling out changes the average reward, and the trailing stop and breakeven planner compares ways to protect it. If the levels come from a signal someone else sent, run them through the trade signal checker first. Then size the position with the position size calculator.
Draw the same plan on your chart
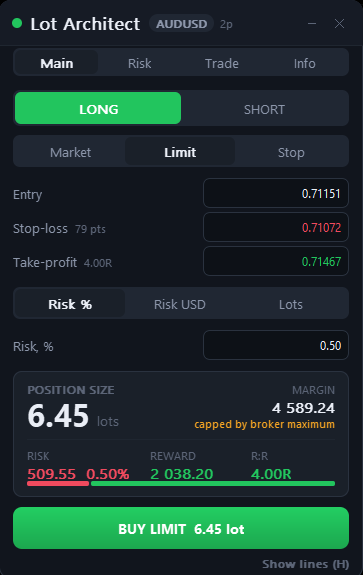
Lot Architect is our utility for exactly this workflow. You drag the Entry, SL and TP lines on the chart and it shows the position size, margin, risk, reward and R:R before you send the order.
- Long or short, market, limit or stop orders
- Size by risk percent, risk in money, or fixed lots
- Order button that shows the lot size it will send
- Press H to hide the lines when you need a clean chart
Worked examples
The same arithmetic the calculator uses, laid out so you can check it by hand.
| Plan | Risk | Reward | R:R | Break-even |
|---|---|---|---|---|
| EURUSD long, 1.00 lot, 20 pip stop, 40 pip target | $200.00 | $400.00 | 1:2.00 | 33.3% |
| XAUUSD short, 0.50 lot, stop 6.00 above, target 9.00 below | $300.00 | $450.00 | 1:1.50 | 40.0% |
| USDJPY long, 1.00 lot, 40 pip stop, 80 pip target (yen converted at 150.00) | $266.67 | $533.33 | 1:2.00 | 33.3% |
| EURUSD, 10 pip stop, 20 pip target, after 1.0 pip spread and $7 commission | $117.00 | $183.00 | 1:1.56 | 39.0% |
For pair-specific numbers, see the EURUSD pip value calculator and the USDJPY pip value calculator. To see the same trade as a profit in your account currency, open the forex profit calculator.
Formulas
Risk to reward: R:R = reward distance / risk distance
Profit or loss in money: distance × contract size × lots, and divide by the price for pairs where USD is the base currency, such as USDJPY
Break-even win rate: risk / (risk + reward)
After costs: net risk = risk + cost and net reward = reward minus cost, where cost is spread plus commission as a price distance
The cost model is a simplification. It adds the full round turn cost to the risk and subtracts it from the reward, which is slightly conservative on trades that run to the target. Yen and franc pairs are converted at your entry price, so very large moves will drift a little from your broker figure. For crosses such as EURJPY or GBPJPY, use the custom instrument and set the quote to USD factor yourself. The full method is on our methodology page.
Risk reward questions
What is a good risk reward ratio?
There is no universal number. The ratio only works together with your win rate, which is why the break-even table matters. At 1:2 you need to win more than 33.3% of trades before costs, at 1:1 more than 50%.
How do I calculate risk reward ratio?
Measure the distance from entry to stop loss, then the distance from entry to take profit, and divide reward by risk. A 20 pip stop and a 40 pip target is 40 / 20 = 2, written 1:2.
How do I calculate profit and loss in dollars?
Multiply the price distance by the contract size and the lots. One lot of EURUSD is 100,000 units, so a 0.0020 move is $200. For USD-base pairs, divide the result by the price to convert it. For other account currencies, use the forex profit calculator.
Why is my R:R lower than the ticket shows?
Spread and commission. Open the costs section and enter them. The ratio after costs is the one your account actually experiences, and it falls fast when the stop is small.
Should I always aim for 1:3?
No. A farther target is hit less often, so a higher ratio does not automatically mean a better trade. Compare the ratio with the win rate you realistically get from your own records.
How much should I risk per trade?
That is a separate decision from the ratio. Pick a risk percent you can live with, then turn it into lots with the position size calculator. The ratio then tells you what the trade can pay for that risk.
Does it work for indices, crypto or stocks?
Yes, through the custom instrument. Enter the contract size, the pip size and the quote to USD factor, and the same math applies. Check the contract size in your broker specification first.
Does the calculator store my numbers?
No. It runs in your browser and does not send the values you type anywhere.
Related tools
Browse every calculator on the free forex tools page.