
Risk of Ruin Calculator: Odds of Blowing Your Account
Enter your win rate, average win and risk per trade, pick the loss that counts as ruin, and see how many out of 100 traders with the same plan get there within the trades you expect to take.
By PA, TachiTrade. Last checked October 11, 2026. How my tools are built
Ruin is a line you choose
The textbook definition of ruin is an empty account. Almost nobody trades that far. A funded trader is finished when the firm’s max loss is touched, and a personal account is in trouble long before zero: after a 50% loss you need a 100% gain to get back, as the drawdown recovery calculator shows.
So the calculator asks where your own line is. It also asks how you size trades, because that changes the odds:
Same dollars every trade
You risk the same amount, measured on your starting balance, trade after trade. A static max loss works this way, and so does a fixed-lot plan.
The line sits a fixed distance away in R. A 10% line with 1% risk is 10R.
Same % of your balance
You risk a share of the balance you have right now, so size shrinks after losses and grows after wins.
The balance can never reach exactly zero, so ruin has to be a line you pick. The distance in R keeps changing.
Win rate, risk and the 10% line
Odds of touching a 10% loss within 500 trades when you risk the same percent of your current balance every trade and your average loss is 1R. Pick the size of your average win.
| Risk per trade | 35% wins | 40% wins | 45% wins | 50% wins | 55% wins | 60% wins |
|---|---|---|---|---|---|---|
| 0.25% | >99.9% | 99.8% | 72.8% | 6.0% | <0.1% | <0.1% |
| 0.5% | >99.9% | >99.9% | 95.6% | 35.5% | 1.4% | <0.1% |
| 1% | >99.9% | >99.9% | 99.1% | 65.3% | 11.8% | 1.2% |
| 1.5% | >99.9% | >99.9% | 99.6% | 78.0% | 25.3% | 5.9% |
| 2% | >99.9% | >99.9% | 99.8% | 84.0% | 34.9% | 10.6% |
| 3% | >99.9% | >99.9% | 99.9% | 90.3% | 49.6% | 21.4% |
| 5% | >99.9% | >99.9% | >99.9% | 95.6% | 67.6% | 40.2% |
| Risk per trade | 35% wins | 40% wins | 45% wins | 50% wins | 55% wins | 60% wins |
|---|---|---|---|---|---|---|
| 0.25% | 85.4% | 12.5% | 0.1% | <0.1% | <0.1% | <0.1% |
| 0.5% | 97.7% | 45.4% | 3.1% | 0.1% | <0.1% | <0.1% |
| 1% | 99.5% | 72.5% | 18.1% | 3.0% | 0.5% | 0.1% |
| 1.5% | 99.8% | 82.7% | 32.5% | 9.7% | 2.9% | 0.8% |
| 2% | 99.9% | 87.8% | 43.1% | 16.8% | 6.4% | 2.3% |
| 3% | >99.9% | 93.1% | 58.2% | 30.6% | 16.0% | 8.2% |
| 5% | >99.9% | 96.9% | 72.9% | 47.0% | 29.6% | 18.2% |
| Risk per trade | 35% wins | 40% wins | 45% wins | 50% wins | 55% wins | 60% wins |
|---|---|---|---|---|---|---|
| 0.25% | 5.4% | <0.1% | <0.1% | <0.1% | <0.1% | <0.1% |
| 0.5% | 27.7% | 1.7% | 0.1% | <0.1% | <0.1% | <0.1% |
| 1% | 55.6% | 12.7% | 2.6% | 0.5% | 0.1% | <0.1% |
| 1.5% | 69.8% | 26.6% | 9.5% | 3.5% | 1.2% | 0.4% |
| 2% | 77.2% | 36.0% | 15.4% | 6.5% | 2.6% | 1.0% |
| 3% | 85.7% | 50.6% | 28.0% | 15.4% | 8.4% | 4.5% |
| 5% | 93.3% | 67.6% | 46.0% | 31.1% | 20.7% | 13.4% |
Italic cells have zero or negative edge: at those win rates the plan does not make money on average, so more trades only make it worse. Computed with the same engine as the calculator above.
Read the 45% column at 1.5R: risking 1% per trade gives 18.1%, risking 3% gives 58.2%. Tripling the size multiplies the odds by about 3.2 times. Edge decides whether the line can be avoided at all, and risk size decides how fast you get there when it cannot.
Your win rate is an estimate
A backtest or a journal gives you a win rate measured on a sample, not the true one. With 100 trades at a measured 45%, the usual 95% range for the true value runs from about 35% to 55%.
Now see what a few points do. Take 45% wins, 1.5R average win, 1% risk, a 10% line and 500 trades. At 45% the odds of touching the line are 18.1%. If the real win rate is 41%, they are 59.8%. At 37% they are 96.1%.
| Trades | Error | 95% range |
|---|---|---|
| 30 | ±9.1 pts | 27% to 63% |
| 50 | ±7.0 pts | 31% to 59% |
| 100 | ±5.0 pts | 35% to 55% |
| 200 | ±3.5 pts | 38% to 52% |
| 500 | ±2.2 pts | 41% to 49% |
| Real win rate | Edge | Odds |
|---|---|---|
| 45% | +0.13R | 18.1% |
| 43% | +0.07R | 35.0% |
| 41% | +0.02R | 59.8% |
| 39% | −0.03R | 83.4% |
| 37% | −0.08R | 96.1% |
| 35% | −0.13R | 99.5% |
That is why I test a plan at a win rate a few points below the measured one, and treat a plan that only works at the measured number as fragile. The stress boxes in the calculator do this for your own numbers.
A ruin line on paper only helps if something watches it
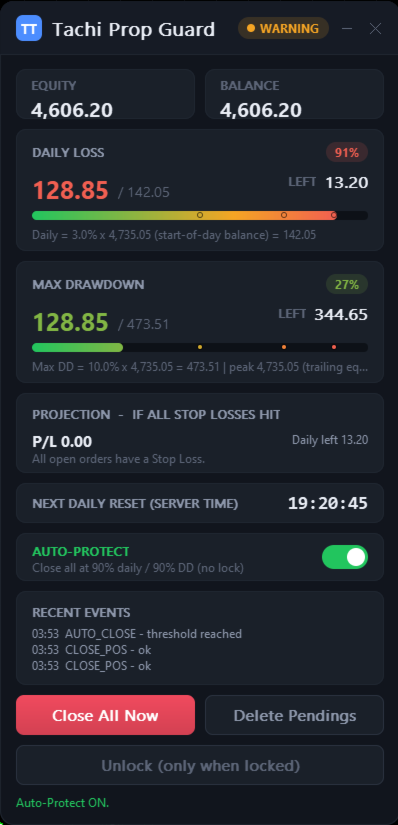
A prop firm’s max loss is a ruin line someone else drew, and the daily limit resets on the firm’s clock, not yours. Tachi Prop Guard for MT5 tracks daily loss and max drawdown against the limits you enter, lets you set the reset time by time zone, and runs in two modes: Monitor only warns you, and Protect can close trades, delete pending orders and lock trading until the next reset.
What it cannot do: it cannot stop another EA’s order before that order is sent, because MT5 has no pre-trade hook. It cannot guarantee fills across gaps or the weekend, it does not guarantee you pass a challenge, and it gives no trade signals.
This is my own product, and I earn money if you buy it. To work out the limits for The5ers, try the drawdown calculator.
How many losses in a row reach it
Losses in a row needed to touch the line when each loss costs 1R and you risk the same percent of your current balance.
| Ruin line | 0.5% risk | 1% risk | 2% risk | 3% risk | 5% risk |
|---|---|---|---|---|---|
| 6% loss | 13 | 7 | 4 | 3 | 2 |
| 10% loss | 22 | 11 | 6 | 4 | 3 |
| 20% loss | 45 | 23 | 12 | 8 | 5 |
| 50% loss | 139 | 69 | 35 | 23 | 14 |
A streak is only one way to get there. A thin edge drifts to the line too, which is why the calculator counts every order of wins and losses, not only streaks. For the odds of a given streak length, see the losing streak table in the expectancy calculator.
What the formula says, and what this page does instead
The classic risk of ruin formula applies when wins and losses are the same size and you keep trading forever:
edge = win rate − loss rate
units = ruin line / risk per trade
Example: 55% wins, equal-size wins and losses, 1% risk, a 10% line. The edge is 0.10 and the line is 10 units away, so ruin = (0.90 / 1.10)10 = 13.4%. If the real win rate is 52%, the edge is 0.04 and the answer becomes 44.9%. Three points of win rate moved it from about 13% to about 45%.
That formula has two limits: it needs equal wins and losses, and it answers for an infinite number of trades. This page counts every possible order of wins and losses over the trades you plan, so unequal payoffs and a finite horizon are handled directly. With the example inputs it gives 11.9% over 200 trades and 13.3% over 500, and it approaches 13.4% in the long run. The engine was checked against that closed form and against a simulation of 200,000 accounts.
Quick answers
What is risk of ruin in trading?
It is the probability that your account falls to a loss you have defined as ruin, given your win rate, your win and loss sizes and how much you risk per trade. It depends on how many trades you take, because more trades give more chances to hit the line.
What is a good risk of ruin?
There is no official number. Many traders want the figure in the low single digits at most, and treat anything above 10% as a reason to cut risk or fix the edge. For a funded account, where ruin also means losing the account and its fee, I would want it lower still.
Why is the risk of ruin high even at 1% risk?
Because small risk only delays a plan without an edge. With zero or negative edge, the line is reached sooner or later whatever the size, as the italic cells in the map show. Cutting size buys time, and a positive edge is what buys safety.
Same dollars or same percent: which should I pick?
Pick the one that matches how you trade. A static max loss and fixed-lot plans fit the first. Percent-of-balance sizing fits the second. For a small line such as 10% the two answers are close. For bigger lines the same-dollars plan usually shows higher odds, because percent sizing shrinks your bets as you lose.
Why is the ruin line capped at 95% for percent-of-balance sizing?
When you risk a share of what is left, the balance shrinks but never reaches zero, so a 100% line can never be touched. The cap keeps the result meaningful. Use the same-dollars mode if you want a true blown account.
How do win rate and average win relate?
Break-even win rate = average loss / (average win + average loss). With 1.5R wins and 1R losses it is 40%. Above that you have a positive edge, below it you do not, and the calculator shows both numbers.
Can this tell me if I will pass a prop firm challenge?
No. Passing needs a profit target inside a time limit and respect for the daily loss rule, and this page only covers the chance of touching a loss line. To size the target side, use the challenge pace calculator.
Why does another calculator give a different number?
Definitions differ. Some answer for an infinite number of trades, some use ruin at zero, some assume equal win and loss sizes, and some size by percent while others use fixed dollars. Match those four choices before comparing numbers.
Related tools
Expectancy Calculator
Edge per trade, profit factor and the losing streak to expect from your own results.
Drawdown Recovery Calculator
The gain needed to get back to break-even after a loss.
Position Size Calculator
Turn the risk percent you settled on into a lot size.
My own indicators and EAs are on MQL5: tachiteam on MQL5. They are my own products, and I earn money if you buy.
This is an educational tool, not financial advice. Trading leveraged products such as forex and CFDs carries a high risk of loss. Read the risk disclaimer. TachiTrade is independent and is not affiliated with any broker or prop firm mentioned here. The results come from a simplified model, and real trading can be worse.