
Edge tools / Free / No sign-up
Expectancy & Break-even Win Rate Calculator
Your win rate means little on its own. Enter it with your average win and loss, or paste your real trade results, and see the edge you have per trade, the win rate you need, and how bumpy the road to it can get.
By PA, TachiTrade. Last updated October 10, 2026. How the numbers are calculated
–
Edge per trade
Expectancy map
Each cell is the edge per trade in R, for a given win rate and average win, assuming every loss is exactly 1R. Green cells make money on average, red cells lose, and the grey ones are close to break-even. Notice how a 65% win rate with small wins can sit in the red.
| Win rate | Win 0.5R | Win 1R | Win 1.5R | Win 2R | Win 3R |
|---|---|---|---|---|---|
| 30% | -0.55R | -0.40R | -0.25R | -0.10R | +0.20R |
| 35% | -0.48R | -0.30R | -0.13R | +0.05R | +0.40R |
| 40% | -0.40R | -0.20R | 0.00R | +0.20R | +0.60R |
| 45% | -0.33R | -0.10R | +0.12R | +0.35R | +0.80R |
| 50% | -0.25R | 0.00R | +0.25R | +0.50R | +1.00R |
| 55% | -0.17R | +0.10R | +0.38R | +0.65R | +1.20R |
| 60% | -0.10R | +0.20R | +0.50R | +0.80R | +1.40R |
| 65% | -0.02R | +0.30R | +0.63R | +0.95R | +1.60R |
| 70% | +0.05R | +0.40R | +0.75R | +1.10R | +1.80R |
Edge per trade = win rate x average win minus loss rate x average loss. Costs come off the top, so add them to the loss and take them off the win.
How long a losing streak to expect
This is the part nobody plans for. The grid shows the longest run of losses you should expect on average over a number of trades, and the length that only 1 run in 10 exceeds. The figures come from an exact calculation, not a simulation, and assume every trade is independent.
| Win rate | 50 trades | 100 trades | 200 trades | 500 trades |
|---|---|---|---|---|
| 30% | 8.8 (1 in 10: 14+) | 10.7 (1 in 10: 16+) | 12.6 (1 in 10: 18+) | 15.2 (1 in 10: 21+) |
| 40% | 6.5 (1 in 10: 10+) | 7.9 (1 in 10: 12+) | 9.2 (1 in 10: 13+) | 11.0 (1 in 10: 15+) |
| 50% | 5.0 (1 in 10: 8+) | 6.0 (1 in 10: 9+) | 7.0 (1 in 10: 10+) | 8.3 (1 in 10: 12+) |
| 60% | 3.9 (1 in 10: 7+) | 4.6 (1 in 10: 7+) | 5.4 (1 in 10: 8+) | 6.4 (1 in 10: 9+) |
| 70% | 3.0 (1 in 10: 5+) | 3.5 (1 in 10: 6+) | 4.1 (1 in 10: 6+) | 4.8 (1 in 10: 7+) |
A 50% win rate over 100 trades usually contains a run of about 5 to 6 losses in a row, and 1 run in 10 reaches 8 or more. That is normal, not a broken strategy.
Three traders, three edges
A high win rate and a profitable system are different things. The last column is one simulated run of 100 trades for each trader, so you can see how far a single run can sit from the average.
| Trader | Win rate | Win / loss | Cost | Edge per trade | Profit after 100 | One run |
|---|---|---|---|---|---|---|
| The 40% sniper | 40% | 2R / 1R | 0R | +0.200R | 91% | |
| The 65% scalper | 65% | 0.5R / 1R | 0R | -0.025R | 38% | |
| The coin flip with costs | 50% | 1R / 1R | 0.1R | -0.100R | 14% |
Profit after 100 is the exact probability of finishing 100 trades above zero, from the binomial distribution, after costs.
What I do with a positive number
A positive expectancy is a description of a sample, not a promise about the next trade. I treat it as permission to keep executing, not as a reason to size up.
The number only means something if every loss is the same size. If your 1R wanders from trade to trade, the average hides it, and the fan chart above will look prettier than your real equity curve.
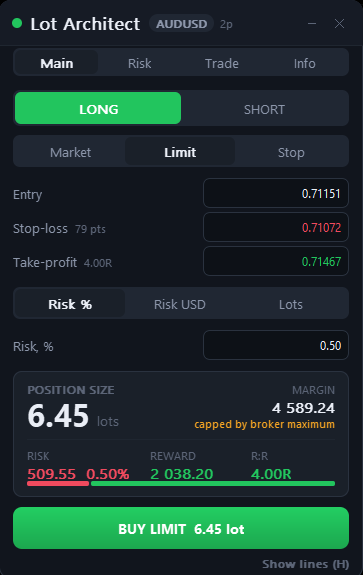
Make every loss exactly 1R
Lot Architect is my MT5 and MT4 utility that sizes the position from your stop and a fixed risk percent or amount, so each trade starts with the same 1R. It also shows the margin, the reward and the R:R before you send the order.
Lot Architect for MT5 MT4 version
It sizes the trade. It does not read prop firm rules and it gives no signals. It is my own product, so I earn money if you buy it.
Formulas
Edge per trade: E = win rate x average win minus loss rate x average loss
Profit factor: gross profit / gross loss
Break-even win rate: average loss / (average win + average loss)
Longest losing streak: the tool tracks the current run of losses over every trade and sums the probability of reaching each length, which gives the expected longest run and the 1 in 10 level.
Spread of results: standard error = standard deviation / square root of the number of trades, and the 95% range of your edge is about two standard errors either side of the average.
The simulation draws trades independently, so it cannot show streaks caused by changing markets or by your own state of mind. Pasted results are resampled with replacement, which keeps your real mix of wins and losses but shuffles the order. Small samples are noisy: 20 trades can look profitable or unprofitable by luck alone.
Expectancy FAQ
What is expectancy in trading?
It is the average amount you make or lose per trade over many trades. A positive number means that, on average, each trade adds to your account. It combines how often you win with how much you win and lose.
How do I calculate expectancy?
Multiply your win rate by your average win, multiply your loss rate by your average loss, and subtract. With a 45% win rate, a 1.8R average win and a 1R average loss, that is 0.45 x 1.8 minus 0.55 x 1 = +0.26R per trade.
What is a good expectancy?
Anything above zero after costs is a positive edge on paper, but how much it matters depends on how many trades you take and how stable the number is. Check it over a large sample, and use the 95% range in the From my trades mode to see how much of it could be luck.
How many trades do I need before I can trust it?
More than most people think. Paste your results and look at the range: with 20 trades it is usually wide enough to include both a profitable and a losing edge. The range narrows with the square root of the number of trades, so four times the trades halves the uncertainty.
What is the break-even win rate?
It is the share of trades you have to win to end up at zero, which is average loss divided by the sum of average win and average loss. At a 1.8R average win and 1R average loss it is 1 / 2.8 = 35.7%.
Does a high win rate mean a good strategy?
No. The expectancy map shows a 65% win rate with 0.5R wins losing money, while a 40% win rate with 2R wins makes money. What matters is the win rate together with the size of wins and losses and your costs.
Can I paste results from my account history?
Yes. Choose Money, then paste the profit column from your closed trades, one value per trade. If you track R multiples in a journal, choose R multiples instead. Commission and swap should already be included in each value.
Does the calculator store my trades?
No. Everything runs in your browser and nothing you type or paste is sent anywhere.
Keep going
Risk reward calculator: the ratio and dollars of a single trade plan.
Drawdown recovery calculator: what a bad streak costs to climb back from.
Position size calculator: keep every trade at the same 1R.
The5ers daily loss and drawdown calculator: check a run against prop firm limits.
Trading leveraged products carries a high risk of loss. This page is educational, shows estimates only, and is not financial advice or a promise of results. Simulations are illustrations, not forecasts. Read the risk disclaimer and the affiliate disclosure. My other tools are on my MQL5 seller page. They are my own products, and I earn money if you buy.