
Risk tools / Free / No sign-up
Drawdown Recovery Calculator
A 50% loss does not need a 50% gain. It needs 100%. Move the slider to see the gain required to get back to break-even, how long that takes at your pace, and how much room a prop firm account has left.
By PA, TachiTrade. Last updated October 10, 2026. How the numbers are calculated
This tab checks the max loss line only. The daily limit is a separate rule, so check it in my daily loss and drawdown calculator. This tool is independent and not affiliated with or endorsed by The5ers. Plans change, so confirm rules on The5ers (affiliate link, I may earn a commission at no cost to you).
The curve is gain needed = loss / (1 − loss). Going from 40% to 60% drawdown adds 83 points to the gain you need, more than the whole first 40% (66.7).
Plan limits used by the presets
| Plan | Max loss | Daily limit |
|---|---|---|
| High Stakes (2 steps) | 10%, static, measured on equity on the dashboard I checked | 3% |
| Hyper Growth (1 step) | 6% | 3% (Daily Pause) |
| Pro Growth (1 step) | 6% | 3% |
| Bootcamp (3 steps) | 5% per step, 4% funded | Not shown in the plan table |
Last verified: October 9, 2026, from the plan comparison table (MetaTrader, USD). Only High Stakes was checked against a live dashboard. Whether the other plans measure the line the same way is something to confirm in the firm rules before relying on this tab.
The recovery ladder
This is the whole idea in one table. Every row is the same formula, so you can read off the gain you need without touching the calculator. The shaded rows are the loss limits that matter on the prop firm plans I checked.
| Loss | Gain needed | Left of $100,000 | Gain / loss | Where it shows up |
|---|---|---|---|---|
| 1% | +1.01% | $99,000 | 1.01 | |
| 2% | +2.04% | $98,000 | 1.02 | |
| 3% | +3.09% | $97,000 | 1.03 | Daily limit on The5ers High Stakes, Hyper Growth and Pro Growth |
| 4% | +4.17% | $96,000 | 1.04 | Max loss in the Bootcamp funded stage |
| 5% | +5.26% | $95,000 | 1.05 | Max loss in each Bootcamp step |
| 6% | +6.38% | $94,000 | 1.06 | Max loss on Hyper Growth and Pro Growth |
| 8% | +8.70% | $92,000 | 1.09 | |
| 10% | +11.11% | $90,000 | 1.11 | Max loss on High Stakes |
| 15% | +17.65% | $85,000 | 1.18 | |
| 20% | +25.00% | $80,000 | 1.25 | |
| 25% | +33.33% | $75,000 | 1.33 | |
| 30% | +42.86% | $70,000 | 1.43 | |
| 40% | +66.67% | $60,000 | 1.67 | |
| 50% | +100.0% | $50,000 | 2.00 | |
| 60% | +150.0% | $40,000 | 2.50 | |
| 70% | +233.3% | $30,000 | 3.33 | |
| 80% | +400.0% | $20,000 | 5.00 | |
| 90% | +900.0% | $10,000 | 10.00 |
Last verified for the plan limits: October 9, 2026. The first column is a percent drop from the peak, the second is the percent rise on what is left.
How long it takes to get it back
The gain you need is only half the problem. The other half is time. This grid shows months to recover at a steady monthly return, compounded. Darker cells mean a longer road.
| Drawdown | 1% / month | 2% / month | 3% / month | 5% / month | 8% / month | 10% / month |
|---|---|---|---|---|---|---|
| 5% | 5.2 | 2.6 | 1.7 | 1.1 | 0.7 | 0.5 |
| 10% | 11 | 5.3 | 3.6 | 2.2 | 1.4 | 1.1 |
| 15% | 16 | 8.2 | 5.5 | 3.3 | 2.1 | 1.7 |
| 20% | 22 | 11 | 7.5 | 4.6 | 2.9 | 2.3 |
| 30% | 36 | 18 | 12 | 7.3 | 4.6 | 3.7 |
| 40% | 51 | 26 | 17 | 10 | 6.6 | 5.4 |
| 50% | 70 | 35 | 23 | 14 | 9.0 | 7.3 |
Cell shading: lightest is 3 months or less, then up to 12 months, up to 36 months, and darkest is more than 3 years. Real months are uneven, so treat the grid as a floor, not a forecast.
Why I treat 10% and 25% as different animals
I have traded Forex for eight years, and funded accounts are where drawdown stops being a number in a spreadsheet. A personal account can sit in a 12% hole for months. A funded account has a hard line, so the same hole is a closed account, not a bad quarter.
I read the ladder in a different order than most people. I do not ask how much I can lose. I ask how many months it would take to earn it back at a pace I have actually delivered, then I size risk so that number stays small.
Most deep drawdowns I know of are not built by the strategy. They are built by a few oversized trades taken to win a loss back, which is the exact moment the math above works hardest against you.
Watch the line while you trade
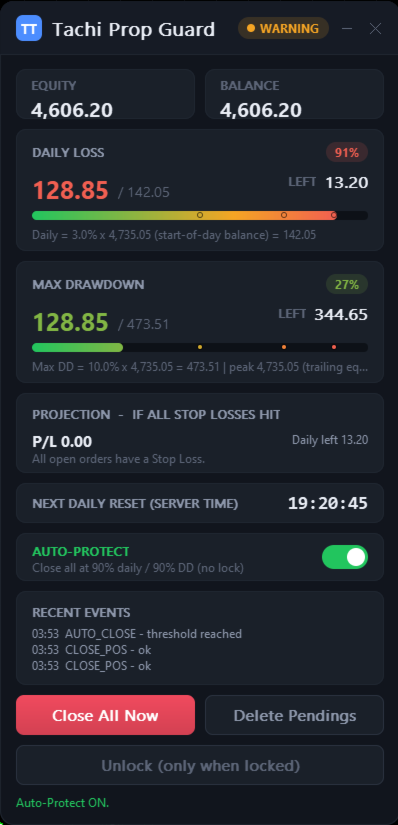
Tachi Prop Guard is an MT5 utility I wrote to track daily loss and max drawdown against your own limits, so you see the room left before a bad trade turns into a breach.
- Daily and max drawdown in percent or money, static or trailing
- Monitor mode, or Protect mode that can close trades, delete pending orders and lock trading until reset
- Projected risk if every stop loss is hit
- Alerts by popup, push or sound, plus a CSV log
What it cannot do: it cannot stop another EA order before that order is sent, because MT5 has no pre-trade hook. It cannot guarantee a fill on a gap or over the weekend, it does not guarantee you pass a challenge, and it gives no trade signals. It is my own product, so I earn money if you buy it.
Before the trade, Lot Architect for MT5 (or MT4) sizes the position from your stop and risk percent, so a single trade cannot dig the hole. Also mine.
Four worked examples
10% down: +11.11%
$100,000 falls to $90,000. You need $10,000 back, which is 10,000 / 90,000 = 11.11% on what is left.
20% down: +25.00%
$100,000 falls to $80,000. The $20,000 gap is 25% of $80,000, so the gain is 1.25 times the loss.
50% down: +100%
$100,000 falls to $50,000. You have to double the account just to be level, and there is no shortcut around it.
Prop: 6% down on 100K
Equity is $94,000 on a $100,000 account. Getting back to the start needs $6,000, or 6.38% on $94,000. If the max loss is a static 10% of the start, the line sits at $90,000. That leaves $4,000 of room, 4.26% of current equity, or four full losses at 1% risk.
The formulas, and what this tool does not do
Gain needed from a loss: gain = loss / (1 - loss)
Loss from a gain, the reverse: loss = gain / (1 + gain)
Months at a steady return r: months = ln(1 / (1 - loss)) / ln(1 + r)
Trades from expectancy: edge per trade = risk x expectancy in R, then trades = ln(1 / (1 - loss)) / ln(1 + edge)
It assumes steady returns and a constant risk percent. Real trading has streaks, so the trade count is an expected value, not a promise, and the half-edge figure is there to remind you how fragile an estimate of your own edge can be. It does not model trailing drawdown rules or broker specific equity calculations, and it does not know your firm. For a rough trailing check, enter your peak equity as the starting balance in the Prop tab, then confirm the firm definition yourself.
Drawdown recovery FAQ
Why does a 50% loss need a 100% gain?
Because the gain is measured on a smaller base. After losing half of $100,000 you hold $50,000, and 50% of $50,000 is only $25,000. You need $50,000 on $50,000, which is 100%.
How do I calculate the gain needed to recover from a loss?
Divide the loss by what is left: gain = loss / (1 − loss), with both as decimals. A 20% loss gives 0.20 / 0.80 = 0.25, so 25%. The calculator above does the same thing and shows it on the curve.
How much drawdown is too much?
There is no universal number, but the ladder gives a way to decide. A 20% drawdown needs 25% back, which at 3% a month is about 7.5 months in the grid. If that timeline is longer than you are willing to wait, your personal stop should sit shallower than 20%. On a prop account the firm sets the hard line for you, and your own limit should sit well inside it.
Is drawdown measured on balance or equity?
It depends on the firm and the plan. On the High Stakes dashboard I checked, the max loss level was a static $90,000 on a $100,000 account and followed equity. Floating losses can count even before you close a trade, so read the rule for your own plan.
What is the difference between static and trailing drawdown?
A static line stays at a fixed level from the starting balance. A trailing line follows a peak, so the room can shrink after profits. The Prop tab is built around a static line, and the starting balance field lets you approximate a trailing line by entering the peak.
How many trades does it take to recover?
It depends on risk per trade and expectancy. With 1% risk, a 45% win rate and a 2R average win, expectancy is 0.35R, worth about 0.35% per trade, so a 20% drawdown takes roughly 64 trades. If the real edge is half that, it takes about 128. Open the Time and trades tab to try your own numbers.
Does this work for futures, stocks or crypto?
Yes. The recovery math does not depend on the instrument, only on percentages. For the Prop tab you set the max loss yourself, so it also works for firms that are not in the presets.
Does the calculator store or send my numbers?
No. It runs in your browser and does not send the values you type anywhere.
Keep going
The5ers daily loss and drawdown calculator: check the daily and max loss levels on a live account.
The5ers position size calculator: turn the room left into a lot size.
Challenge target pace calculator: how fast the profit target needs to move.
Position size calculator: risk percent and stop to lots for any pair.
Trading leveraged products carries a high risk of loss. This page is educational, shows estimates only, and is not financial advice or a promise of results. Read the risk disclaimer and the affiliate disclosure. My other tools are on my MQL5 seller page. They are my own products, and I earn money if you buy.