
Fibonacci & Pivot Point Calculator
Type a swing low and high, or the last session’s high, low and close. You get every retracement, extension and pivot level in one table, drawn on a price ladder, with a level-to-level reward-to-risk check. Works on any symbol.
- Retracements and extensions
- 4 pivot methods side by side
- Up or down swings
- Level-to-level R:R
- Runs in your browser
Educational calculator, not trading advice. Levels are reference prices, not predictions. See the risk disclaimer.
Where the ratios come from
Most Fibonacci ratios used in trading come from the golden ratio, 1.618. Two of the levels you will see on every chart are not Fibonacci numbers at all, and it helps to know which ones.
| Level | Where it comes from | Value |
|---|---|---|
| 23.6% | 1 divided by 1.618 three times | 0.2361 |
| 38.2% | 1 divided by 1.618 twice | 0.3820 |
| 50% | Half the move. Not a Fibonacci ratio | 0.5000 |
| 61.8% | 1 divided by 1.618 | 0.6180 |
| 78.6% | Square root of 0.618 | 0.7862 |
| 127.2% | Square root of 1.618 | 1.2720 |
| 161.8% | The golden ratio itself | 1.6180 |
| 200% | Twice the swing. Not a Fibonacci ratio | 2.0000 |
| 261.8% | 1.618 squared | 2.6180 |
The ratios are fixed. What you choose, the swing low and the swing high, is where all the judgement sits. The next section shows why.
One candle, four pivot methods
All four methods start from the same three prices, the previous session’s high, low and close, and then spread levels around a central pivot in different ways. Here they are on one example candle (high 2,412.50, low 2,368.20, close 2,401.80).
| Level | Classic | Fibonacci | Camarilla | Woodie |
|---|---|---|---|---|
| R4 | − | − | 2,426.17 | − |
| R3 | 2,464.43 | 2,438.47 | 2,413.98 | − |
| R2 | 2,438.47 | 2,421.54 | 2,409.92 | 2,440.38 |
| R1 | 2,420.13 | 2,411.09 | 2,405.86 | 2,423.95 |
| P | 2,394.17 | 2,394.17 | 2,394.17 | 2,396.08 |
| S1 | 2,375.83 | 2,377.24 | 2,397.74 | 2,379.65 |
| S2 | 2,349.87 | 2,366.79 | 2,393.68 | 2,351.77 |
| S3 | 2,331.53 | 2,349.87 | 2,389.62 | − |
| S4 | − | − | 2,377.44 | − |
Camarilla stays close to the close. Its first levels sit only about 4.06 points either side of the close, while Classic puts R1 and S1 about 44.30 points apart. Same candle, very different spacing. Camarilla suits traders who want many nearby levels; Classic and Fibonacci give wider zones.
Woodie weights the close twice in the pivot, so its central level sits nearer the close. We use the common form P = (H + L + 2C) / 4 and leave out Woodie R3, S3, R4 and S4, which platforms define differently.
The swing you pick is the analysis
Here is a schematic up swing from 100 to 200, with the levels the calculator draws. The shaded band is the 38.2% to 61.8% zone many traders watch for a pullback to end.
Schematic only, not a real chart or a recorded trade.
- Anchor on swings that stand out. If you have to squint to see the high or the low, someone else will pick a different one and see different levels.
- Use the wicks or the closes, but be consistent. Pick one and keep it for the whole analysis.
- Keep one swing per timeframe. Levels from a daily swing and a 15-minute swing sitting on the same chart quickly turn into noise.
- Redraw when the swing is broken. If price makes a new high above your swing high, the old levels no longer describe the current move.
Turn levels into a plan
A level only becomes a plan when it has an entry, a stop and a target. In the R:R tab you pick all three from the swing’s own levels. Here are three combinations on an example up swing from 2,300.00 to 2,400.00 (illustrative numbers, not a signal).
| Entry | Stop | Target | Risk | Reward | R:R | Break-even win rate |
|---|---|---|---|---|---|---|
| 61.8% (2,338.20) | 100% (2,300.00) | 0% (2,400.00) | 38.20 | 61.80 | 1 : 1.62 | 38.2% |
| 50% (2,350.00) | 78.6% (2,321.40) | 0% (2,400.00) | 28.60 | 50.00 | 1 : 1.75 | 36.4% |
| 38.2% (2,361.80) | 61.8% (2,338.20) | 127.2% (2,427.20) | 23.60 | 65.40 | 1 : 2.77 | 26.5% |
Notice that the 61.8% entry in the first row gives a smaller reward than the 38.2% entry with an extension target in the third. The deeper the pullback, the closer your stop can sit, but the less room is left to the old high. The break-even win rate is the share of trades you need to win for that combination to cover its losses before costs. For dollars, spread and commission, use our risk reward calculator.
Levels give you prices. Lines give you size
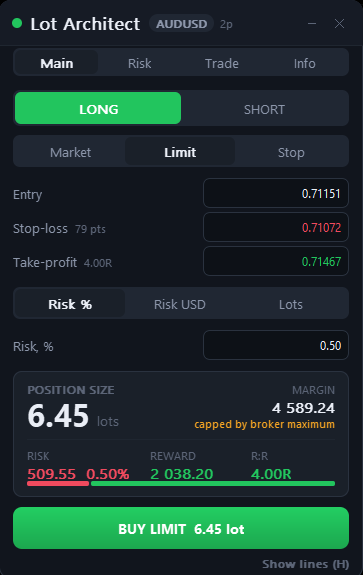
Once you have an entry, a stop and a target from this page, Lot Architect turns them into lines on your MetaTrader chart and works out the position size from your risk.
- Drag Entry, SL and TP lines on the chart
- Size by risk %, risk in USD or fixed lots
- Shows size, margin, risk, reward and R:R
- Long or short; market, limit and stop orders
Lot Architect is our own product, so we earn money if you buy it. It does not draw Fibonacci retracements or pivot points; MetaTrader has its own tool for that. It does not guarantee profits.
What these levels are not
Fibonacci and pivot levels are prices that many traders look at. That can make them useful places to plan an entry or a stop, because there is often a reaction near them. It does not make them a trading edge on its own, and no ratio is guaranteed to hold.
If you trade them, record each trade with the level you used and see what the numbers say after a few dozen trades. Our trading journal keeps that record in your browser, and the expectancy calculator tells you what the results are worth per trade.
Fibonacci and pivot FAQ
Which Fibonacci retracement levels should I use?
The 38.2%, 50% and 61.8% levels are the ones most traders start with, with 23.6% and 78.6% used for shallow and deep pullbacks. No level is proven to work better than the others, so test your choice on your own trades rather than copying a preset.
Is 50% a Fibonacci ratio?
No. It is simply half of the move. It is on most Fibonacci tools because traders watch it, but it does not come from the golden ratio.
What is the difference between a retracement and an extension?
A retracement measures how far price pulls back inside the swing, from 0% to 100%. An extension projects the same swing beyond it, 127.2% or 161.8% for example, and is used to place targets. Here, an up swing extends above the swing high and a down swing extends below the swing low.
Which candle do I use for daily pivot points?
The previous day’s high, low and close. In forex the day boundary depends on your broker’s server time, so check where your daily candle closes with our forex market hours tool before you copy numbers from a chart.
Why do the Camarilla levels look so tight?
Camarilla builds its levels from the close using small fractions of the range, such as 1.1 divided by 12 for the first level. Classic and Fibonacci pivots build from the central pivot and use much larger steps.
Can I use this for gold and indices?
Yes. The formulas only need prices, so they work for any instrument. For XAUUSD, take the swing or the daily high, low and close from your own chart. To size the trade, use our XAUUSD lot size calculator.
Can I put the levels on my MetaTrader chart?
Yes, by hand. Copy the levels with the button above and place horizontal lines at those prices. This page does not install anything on your platform.
Do you store the numbers I type?
No. The calculation runs in your browser and nothing you enter is sent to a server.
Related tools
How our tools are built: methodology.