
Free Online Trading Journal
Log each trade in under a minute and see what your results really say: win rate, expectancy in R, equity curve, and which setups, weekdays and mistakes make or lose you money. Nothing to sign up for. Your journal is saved in your own browser.
- Saved in your browser
- No sign-up, no upload
- R-multiple statistics
- Equity curve
- CSV export and import
Your trades stay on this device and are never sent to our servers. Educational tool, not trading advice. See the risk disclaimer and privacy policy.
Eight fields, no more
Journals fail because they take too long. Every field here exists because a statistic in the Stats tab needs it, and nothing else is asked.
| Field | The question it answers | Where it shows up |
|---|---|---|
| Date | When do I trade best? | Weekday bars, equity curve order |
| Symbol | Which markets pay me? | Journal filter |
| Side | Am I better long or short? | Long or short bars |
| Setup | Which of my ideas actually earns? | By-setup bars, filter |
| Planned risk | How big was 1R on this trade? | R multiple and expectancy in R |
| Result | What did it pay or cost? | Every statistic |
| Mistake | What do my errors cost me? | By-mistake bars, mistake tax |
| Note | Why did I take it? | Journal list |
What the Stats tab tells you
This is what the page produces from its built-in 30 sample trades (press Load 30 sample trades in the Data tab to see it yourself). The sample is made up for demonstration and is not a real account or a result you should expect.
| Measure | Sample value |
|---|---|
| Trades | 30 |
| Win rate | 36.7% |
| Net result | $161.37 |
| Average win | $102.91 |
| Average loss | −$51.09 |
| Profit factor | 1.17 |
| Expectancy per trade | $5.38 |
| Expectancy in R | 0.11R |
| Longest losing streak | 5 |
| Max drawdown | −$262.96 |
| Setup | Trades | Win rate | Net | Expectancy |
|---|---|---|---|---|
| Sweep + CHoCH | 14 | 50% | $317 | 0.45R |
| Breakout | 6 | 33% | $10 | 0.03R |
| Range fade | 10 | 20% | −$165 | −0.33R |
How to read it. The setups differ because we gave the sample setups different win rates on purpose. In a real journal, the differences are usually smaller and noisier, and 30 trades is far too few to trust any of them. Use the table to learn what to look for, then wait for your own sample to grow.
The mistake line is the one many traders skip. In the sample, the 5 trades tagged with a mistake net −$254.21, against $415.58 on the 25 trades without one. That gap is what we call the mistake tax: the cost of breaking your own rules, in dollars.
A ten-minute weekly review
- Look at the equity curve first. Is the slope steady, or does one trade carry the week? A single outlier says little about the process.
- Open By mistake. If one mistake tag has the biggest loss, that is next week’s only rule to fix.
- Compare setups, but only with enough trades. Under about 30 trades per setup, the differences are mostly luck.
- Read three notes. Pick your best trade, your worst trade and one boring trade. Ask whether you followed the plan, not whether it worked.
- Write one change. Not five. Put it in the note of next Monday’s first trade.
Once you have 30 or more trades with planned risk filled in, paste the expectancy and win rate into our expectancy calculator to see the losing streak you should expect, and into the risk of ruin calculator to check your risk per trade.
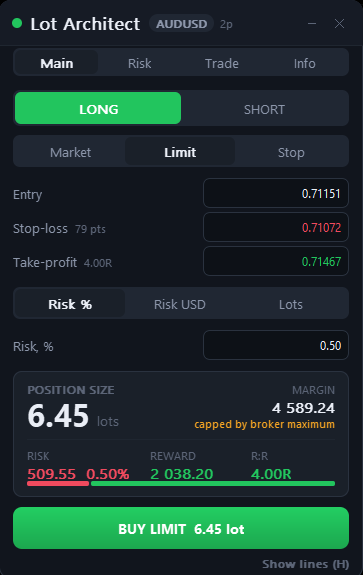
Fill the risk field with the number you really used
R only means something if every trade starts with a known risk. Lot Architect shows the risk in dollars, the lot size and the reward-to-risk on your MetaTrader chart before you place the order, so the planned risk you log here is the real one.
- Size by risk %, risk in USD or fixed lots
- Drag Entry, SL and TP lines on the chart
- Shows size, margin, risk, reward and R:R
Lot Architect is our own product, so we earn money if you buy it. It does not write to this journal and does not guarantee profits.
Building a pre-trade routine too? Our MQL5 seller page lists the other tools we make, including Entry Discipline Checklist for MT5. Read each product page for what it does.
Where the journal is stored
In this browser, on this device. The journal uses your browser’s local storage. It is not uploaded, and we cannot see it or recover it.
It can disappear. Clearing site data, using a private window or switching browser starts you from empty. Export a CSV from the Data tab every week or two and keep the file.
It does not sync. A trade logged on your phone will not appear on your laptop. Export on one device and import on the other.
This is a personal log, not a broker statement. Use your platform history for tax or compliance records, and treat the figures here as your own notes.
Trading journal FAQ
Is this trading journal really free?
Yes. There is no account, no limit on trades and no paid tier. We built it so traders have a reason to come back to our tools; we make money from our own products and affiliate links, which are always labelled.
Where is my data saved?
In your browser’s local storage on this device. Nothing is sent to our server. That also means we cannot restore it if you clear your browser data, so export a CSV regularly.
Why do I need planned risk?
To turn dollars into R. A $120 win means little by itself; 2.4R on a $50 risk tells you how the trade compared with your plan. Leave it empty and the journal still works, it just skips the R figures.
What does expectancy mean here?
It is the average result per trade. In dollars it is net result divided by the number of trades; in R it is the average R multiple of the trades that have planned risk.
How many trades do I need before the stats mean anything?
More than most people expect. Thirty trades is a minimum to start looking at patterns, and splits by setup or weekday need that many in each group. Until then, use the journal for notes and the mistake tag rather than for conclusions.
Can I move my trades from a spreadsheet?
Yes. Arrange the columns as date, symbol, side, setup, risk, result, mistake, note, export as CSV, and paste the rows in the Data tab. Rows that do not fit are skipped and counted.
Does it connect to MetaTrader or my broker?
No. You enter trades yourself. That keeps it private and works with any broker or platform.
Can I use it on my phone?
Yes, the page works on small screens. The Journal table scrolls sideways when it is wider than your screen.
Related tools
How our tools are built: methodology.