
Forex Compounding Calculator: See Where Monthly Returns Really Lead
See where a trading account lands when profit stays in and earns more profit. Add monthly deposits, take some profit out, and test real month-to-month swings instead of a perfectly straight line.
| Year | Start | Added | Profit | Withdrawn | End |
|---|
One calculator, three ways to ask
Where will I be?
Start balance, monthly return and time. You get the typical result and the range around it.
What return do I need?
Start balance, target and deadline. You get the steady monthly return the plan demands.
How long will it take?
Start balance, target and return. You get the time on a steady path and the time with swings.
Profit that earns profit
Compounding means each month’s return is applied to the balance you have now, and that balance includes everything you earned before. Earn 3% on $5,000 and you have $5,150. Next month the 3% is taken on $5,150, not on $5,000.
r = monthly return as a decimal, n = number of months
With deposits D at the end of each month:
Balance = Start × (1 + r) n + D × ((1 + r) n − 1) / r
The formula is the easy part. The calculator adds what the formula leaves out: swings from month to month, profit you take out, and the fact that a deposit made in year three earns far less than one made on day one.
What a monthly return turns into
How many times your starting balance a steady monthly return produces, with no deposits and no withdrawals.
| Monthly return | 1 year | 2 years | 3 years | 5 years | Per year |
|---|---|---|---|---|---|
| 1% | ×1.13 | ×1.27 | ×1.43 | ×1.82 | 12.7% |
| 2% | ×1.27 | ×1.61 | ×2.04 | ×3.28 | 26.8% |
| 3% | ×1.43 | ×2.03 | ×2.90 | ×5.89 | 42.6% |
| 5% | ×1.80 | ×3.23 | ×5.79 | ×18.7 | 79.6% |
| 8% | ×2.52 | ×6.34 | ×16.0 | ×101 | 151.8% |
| 10% | ×3.14 | ×9.85 | ×30.9 | ×304 | 213.8% |
Read across the 3% row: a steady 3% a month is ×2.03 after two years, and 42.6% a year when compounded. Now read the 10% row: five years of 10% a month would multiply the account by ×304. The curve is the reason compounding tables look so exciting, and the reason to ask how long a return can really be held.
Swings cost you growth
Two months, same average
Month one earns 9%, month two loses 3%. The average is 3%. But 1.09 × 0.97 = 1.0573, while two steady 3% months give 1.03 × 1.03 = 1.0609.
The steady path wins even though the average is the same.
The bigger the swing, the bigger the gap
Typical growth follows the geometric mean of an up month and a down month. With an average return of 3% and a swing of ±6%, that is 2.83% a month, not 3%.
The calculator shows both numbers, so you can see the drag.
The table below uses a 3% average month, $5,000, and 36 months. Only the size of the swing changes.
| Monthly swing | Typical result | Bad luck (1 in 10) | Good luck (1 in 10) | Ends below $5,000 | Real growth a month |
|---|---|---|---|---|---|
| None | $14,491 | $14,491 | $14,491 | 0% | 3.00% |
| ±3% | $14,272 | $11,305 | $18,018 | 0% | 2.96% |
| ±6% | $13,631 | $8,549 | $21,735 | 0.2% | 2.83% |
| ±10% | $12,220 | $5,607 | $26,635 | 6.6% | 2.51% |
| ±15% | $9,852 | $3,047 | $31,852 | 20.3% | 1.90% |
With no swing, $5,000 becomes $14,491. With a ±6% swing the typical result is $13,631, and one account in ten ends below $8,549. At ±15% the typical account is worth $9,852, below where it started, and 20% of accounts end under $5,000. Same average return, very different lives.
What return does a target need?
The steady monthly return needed to multiply the starting balance, with no deposits. Use the second mode of the calculator to add deposits and a target in dollars.
| Goal | 12 months | 24 months | 36 months | 60 months |
|---|---|---|---|---|
| Grow ×2 | 5.9% | 2.9% | 1.9% | 1.2% |
| Grow ×3 | 9.6% | 4.7% | 3.1% | 1.8% |
| Grow ×5 | 14.4% | 6.9% | 4.6% | 2.7% |
| Grow ×10 | 21.2% | 10.1% | 6.6% | 3.9% |
Doubling in a year takes 5.9% every single month. Turning $5,000 into $50,000 (×10) in five years takes 3.9%. Longer deadlines make a target far more reasonable than a faster return does.
Withdrawals slow the curve
Withdrawing profit feels harmless because the account still grows. It also removes the money that would have compounded.
Here $5,000 earns 3% a month for 36 months, and a share of each month’s profit is taken out. Taking out half cuts the final account by about 41% compared with leaving everything in, though you have the cash.
Loss months withdraw nothing. The calculator applies the share only to months that make money.
| Share out | Account | Cash out | Total |
|---|---|---|---|
| 0% | $14,491 | $0 | $14,491 |
| 25% | $11,139 | $2,046 | $13,185 |
| 50% | $8,546 | $3,546 | $12,091 |
| 75% | $6,543 | $4,630 | $11,173 |
| 100% | $5,000 | $5,400 | $10,400 |
Your lot size should grow with the account
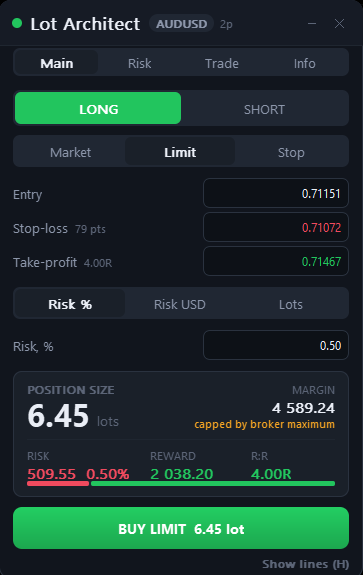
A compounding plan assumes you risk the same share of the balance every time. Doing that by hand means working out a new lot size on every trade. Lot Architect for MT5 and MT4 does the calculation on the chart: choose Long or Short, Market, Limit or Stop, and size by Risk %, Risk USD or Lots. Drag Entry, Stop Loss and Take Profit on the chart, and it shows size, margin, risk, reward and R:R, with the lot size on the order button.
What it does not do: it does not read prop firm rules, it does not tell you what to trade, and it does not compound for you or promise any profit. It only sizes the trade you chose.
This is our own product, and we earn money if you buy it. For a quick one-off size, try the position size calculator.
Quick answers
How do you calculate compounding in forex?
Multiply the balance by one plus the monthly return, then repeat for every month. With a 3% monthly return, $5,000 becomes $5,150 after one month, $5,304.50 after two, and about $14,491 after 36. Deposits are added at the end of each month, after that month’s return.
What monthly return is realistic?
There is no standard number, and it differs for every trader and every year. Use the ladder table above to see what each rate implies, and be suspicious when the result looks too good: 10% a month for five years is a multiple of about ×304. A safer habit is to test a lower return than the one you hope for and check the plan still makes sense.
Why does the monthly swing lower my result?
Because losses hurt more than equal gains help. A 50% loss needs a 100% gain to recover, as the drawdown recovery calculator shows. Over many months, uneven results grow slower than steady ones with the same average.
Is the compounding monthly or per trade?
Monthly. Your return is applied once a month. If you resize every trade, you compound a little more often, which changes the numbers slightly but not the shape of the curve.
How do deposits and withdrawals work?
A positive monthly deposit is added at the end of each month. A negative number is taken out instead. The balance cannot fall below zero. The “profit withdrawn” box is separate: it takes a share of each month’s profit and leaves loss months alone.
What do “9 in 10” and “typical” mean?
Typical is the median: half of the possible outcomes end above it and half below. The 9 in 10 range runs from the 10th to the 90th percentile, so one outcome in ten is worse than the low end and one in ten is better than the high end.
Will I get different numbers each time I use it?
No. With no deposits the calculator counts every possible sequence of good and bad months exactly. With deposits it runs 4,000 simulated paths using a fixed starting seed, so the same inputs always give the same answer.
Does this mean I can turn a small account into a big one?
No. The calculator shows arithmetic, not a promise. It assumes you can earn the same return month after month with no fees, slippage or bad streaks, and holding a return for years is the hard part. To see how bad streaks can end a plan, try the risk of ruin calculator.
Related tools
Drawdown Recovery Calculator
The gain needed to get back to break-even after a loss.
Risk of Ruin Calculator
The odds of hitting a loss line within the trades you plan.
Expectancy Calculator
Edge per trade and profit factor from your own results.
Position Size Calculator
Turn a risk percent into a lot size.
Our own indicators and EAs are on MQL5: tachiteam on MQL5. They are our own products, and we earn money if you buy. How our tools are built.
This is an educational tool, not financial advice. Trading leveraged products such as forex and CFDs carries a high risk of loss. Read the risk disclaimer. TachiTrade is independent and is not affiliated with any broker or prop firm mentioned here. The results come from a simplified model, and real trading can be worse.